


Kassey Lee examines the market for .com domain names in China.
In my series of articles to study the Chinese domain market, I have already covered the big picture and. Today, let’s look at .com. This analysis is based on data I have collected from China Internet Network Information Center reports published since 1997.
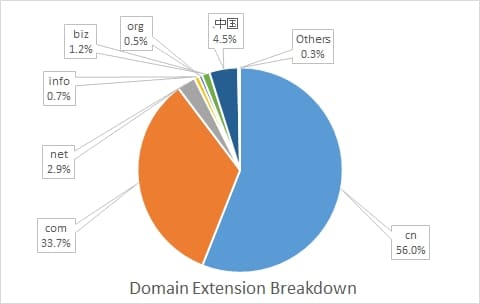
The chart shows a breakdown of domains registered in China as of December, 2018. However, do not be misled by the numbers and conclude that .com is less important than .cn. It’s actually the opposite. Although smaller in number, .com is king in corporate China and has achieved the highest prices in domain sale. A small sample is listed below.
- Voice.com was sold for $30 million to Hong Kong-based block.one in 2019.
- 360.com was sold for $17 million to Beijing-based Qihoo 360 in 2015.
- Le.com was sold for $10 million to Beijing-based Le TV in 2015.
- We.com was sold for $8 million to Beijing-based Ren Ren Dai in 2015.
- Vivo.com was sold for $2.1 million to Guangdong-based Vivo in 2015.
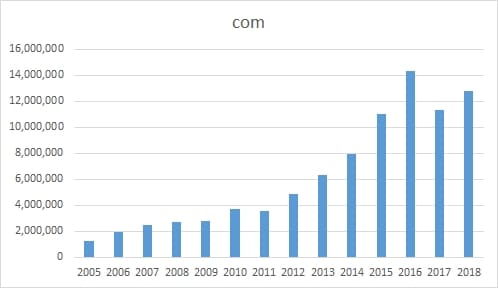
The chart shows that .com is generally on the up trend. The number of .com domains registered as of December 2018 was 12.8 million. However, note that there are still many Chinese owned domains located overseas. For example, Voice.com, Baidu.com, Tencent.com, JD.com, and DJI.com are all registered in the US. Therefore, the actual number should be much higher.
A particular event needs to be mentioned. In 2015, someone invented an investment theme called “chips” ([Chi]nese + [P]remium in plural form). It refers to a domain not containing the aeiouv letters — which was soon expanded to include numbers not having 0 and 4. Such domains were promoted as being more valuable. Speculators flocked in and registered a lot of random .com domains in 5L, 6N, 7N, and other types. The “chips” boom ended in 2017 with a dip. Nevertheless, growth returned in 2018.
Long term, I see a very solid .com domain segment in China. The love for .com is deep rooted in corporate China and will likely remain so unless there is drastic change in the regulations to disfavor .com. On the other hand, note that Chinese love speculation, so let me end by speculating that new investment themes will pop up and many more speculative booms will appear. The 2015 “chips” boom is only a preview of what is to come.

This breakout appears to miss out on nTLDs. .icu has more than 3 million registrations in China. Add .top, .xyz, .vip, etc. both your total domain count and the market share calculation are off by quite a margin.
The analysis is based on data officially provided by CNNIC. Happy to look at other extensions when CNNIC includes them in their annual surveys of the domain landscape in China..
Thanks for your detailed analysis on .com market in China. The .com owners of 1-2 word brandable domains, short, LL, LLL have great future.
TOTALLY DISAGREE. They are abandoning the USA .com for their own nTLD. Their government is not going to allow it. They are SHUTTING USA OUT! Trade wars will NEVER resolve, this has been the plan for YEARS – i have wrote about it extensively.
1. GA .icu 4,359,100 27,690 14.13%
2. GA .top 3,673,891 4,855 11.91%
3. GA .xyz 2,818,189 2,154 9.14%
4. GA .site 1,998,083 -6,559 6.48%
5. GA .club 1,478,024 -776 4.79%
6. GA .online 1,408,926 -1,323 4.57%
7. GA .vip 1,343,104 20,611 4.35%
8. GA .wang 942,151 32,608 3.05%
9. GA .work 712,017 -1,968 2.31%
Most those are CHINESE run nTLD – THOSE WILL BE WHAT IS ALLOWED.
DON’T get FOOLED by PROPAGANDA!
Hello? Knock knock, anyone home? They own MOST the nTLD more than ANYONE;
1. China 12,682,940 41.12%
2. Whois Proxy (Unknown Registrant) 6,256,994 20.29%
3. United States of America 3,337,155 10.82%
4. Japan 927,211 3.01%
5. Germany 633,811 2.05%
6. France 584,807 1.90%
7. United Kingdom (Great Britain) 426,964 1.38%
8. Canada 354,686 1.15%
9. Russian Federation 291,484 0.94%
(older stats but the big picture hasn’t changed)
SEEMS TO ME, THEY LOVE nTLD!
That’s right, if this research were HONEST there are as many nTLD as .com in china #FAKE NEWS!